Wednesday, 15 July 2015

SVG with RaphaelJS - Creating Interactive Maps Part 1

Welcome to this section of the weekly series SVG with RaphaelJS. This week we will be going into the creation of interactive maps.

My country of focus for this will be Liberia. Liberia has suffered from the scourge of the Ebola virus and has been in the news. To this end, I have decided to do this tutorial with a focus on Liberia. The principles here can be extended to any country of your choice.

First Things First

You must understand the process of creating an interactive map of a country is classed under Data Visualization. As a result, I will use the process of creating Data Visualization to explain what I am doing.

The process of Data Visualization is listed below:

  1. Acquire
  2. Parse
  3. Filter
  4. Mine
  5. Represent
  6. Refine
  7. Interact
Acquire

We start the process of Data Visualization by obtaining the data we want to visualize. In our case, we what to visualize Counties in Liberia. This is a lot like saying State in Nigeria or Regions in Ghana. To do this, we must do a Google search for SVG map of the Counties in Liberia.


Fortunately, the first result is what I am looking for. You click on the link and you should see this page.


It contains a link to all the SVG files for the 15 Counties in Liberia. So what you need to do is open each of the maps in a new tab. I prefer to do this because the SVG maps are coloured and their counties are named. I prefer to do this because the SVG maps are coloured and as a result you could quickly look at the markup and find which county fits which by looking at the SVG file.
Please remember that SVG is an image file represented by text. So by studying the styling of the maps, you can guess which one belongs to a particular county.
When you open any of the tabs for the maps, you should see the following:

So click on the download link and select full resolution from the popup displayed.

Once you have all 15 county maps on your machine, the hardwork starts. Do remember that your files must be in the SVG format. Please read up on the SVG format if you don't understand it.

Parse
Here the goal is to provide some structure into the data's meaning and order it into categories. For our purposes, parsing will be done manually. Open all the 15 SVG files using your text editor and view the source code that generates the images.

Personally this is the hard part. You want to look at all the 15 files and try to isolate their commonalities. What you really want to watch out for is the style attribute. In each of the maps, one county is red. The goal is to understand the structure of the SVG file.

In order to extract a path, we need to get the values of each path for the county. To do this, use the browser window to extract the source of the SVG image by clicking on the map.


Of particular interest in unraveling the secret of this map is to look for the attribute for a path. This is shown below:

Copy your d value for the county in question and save it in a file called path.js. Use the following format.
pathNumber:{
name: "",
path: ""
}

Filter
The goal is to remove all but the data of interest. For our map, we intend to isolate only the paths that will give us the counties. This is where the data is unique to this project. Find the path value for the red outlined SVG shape and select it. Note that each path belongs to a County in Liberia. So note the County name and associate it with the path it belongs to.
Follow the format given above for all the 15 counties in Liberia. In the end, we have a path file which has the paths for all the Counties in Liberia. With this file, we will create the map of Liberia. Next time, we will look at making the map interactive.
The complete path file for Liberia is available at the GitHub repository for this course. You can download it from there.
Next week, we will use this file to create an interactive map of Liberia.

Conclusion
So we have come to the end of this week's section of the SVG with RaphaelJS series. We have learned how to extract the paths the administrative divisions of a country.
My challenge to you is to use this knowledge and create the path file for your country. 

Have a great week.

Tuesday, 9 June 2015

Exporting For Android On The Godot Game Engine


The Godot Game Engine is an open-source alternative to the Unity game engine. It can be used to create both 2D and 3D games for a variety of platforms as shown below.


I got introduced to it last week Saturday and I am making these notes to document how to configure the engine to export to Android. The export to the Linux, Mac OSX and Windows Desktop are straight forward.

To configure the engine to export to Android, follow the following steps:
  1. Download and install the Java 6 SDK.
  2. Download and install the Android SDK
  3. Generate a debug key for signing your APK use this command in your command prompt:  keytool -keyalg RSA -genkeypair -alias androiddebugkey -keypass android -keystore debug.keystore -storepass android -dname "CN=Android Debug,O=Android,C=US" -validity 9999
  4. Launch the Godot game engine, then go to Settings. Choose install Export templates and load in the export template zip file which is available on the Godot website
  5. Now click on Editor Settings and fill in the values for your Adb, Jarsigner and Debug Keystore
For the purpose of reference, mine are
Adb: C:/Program Files (x86)/Android/android-sdk/platform-tools/adb.exe
Jarsigner: C:/Program Files (x86)/Java/jdk1.6.0_45/bin/jarsigner.exe
Debug Keystore: C:/Users/Truston Ailende/debug.keystore

Friday, 5 June 2015

How I Created My First Android Game Using The Corona SDK


I developed my first game in 2010 for the Samsung Application Developers Contest. I came 2nd in the Casual Games Puzzles Category.

In the years to come I would go through a lot of tools in my quest to find one suitable with my reality. This year, that search ended as I found the Corona SDK.

On the 20th of March this year, I downloaded the Corona SDK. I spent the weekend looking through the sample code and by the next week I was convinced that I had found a tool that would enable me create 2D games with the only limit being my imagination.

The following reasons are why I settled on the Corona SDK. They are:
  1. Free
  2. Low hardware requirements
  3. Easy to use and learn
  4. Rapid application development
  5. Cloud compilation of applications
The above features matter because of the hardware I have. As you know, the Android SDK is slow. However, on a Windows machine it is plain disgusting. With that in mind, having a cloud compilation tool meant that I would avoid using the Android emulator.

The Corona SDK simulator is quite fast even on machines with low hardware specifications. This means that I could use my machine to develop the applications.

The cloud build needs JDK 6 on a Windows machine. Once it is installed, you are good to go. However, you must sign the application with a key. To do this, type the following into your command prompt:

keytool -genkey -v -keystore project_name.keystore -alias project_name -keyalg RSA -validity 999999

Replace project_name with the name of your project. You need this keystore before you can do your build.

Testing on my machine was done using BlueStacks which allows you to run Android apps on your machine. Once I finished the Corona SDK cloud build, I tested the results on my BlueStacks installation. It was a moment of baited breath as I watched the installation begin.

Finally the installation concluded and I watched the game launch on BlueStacks. Once I didn't have any problems, I tested it on an actual device.

At last it was time to go to the Google Play store. It was a moment of anxiety wondering if my credit card would be rejected because of my nationality.

In the end, the application go published. Without the Corona SDK, I wouldn't have come this far.

Friday, 22 May 2015

SVG with RaphaelJS - Defining Object Boundaries


Welcome to this section of the weekly series SVG with RaphaelJS. In the last section, we covered how to drag and drop a RaphaelJS element. In this section, we shall cover how to detect if two RaphaelJS elements are colliding with each other.

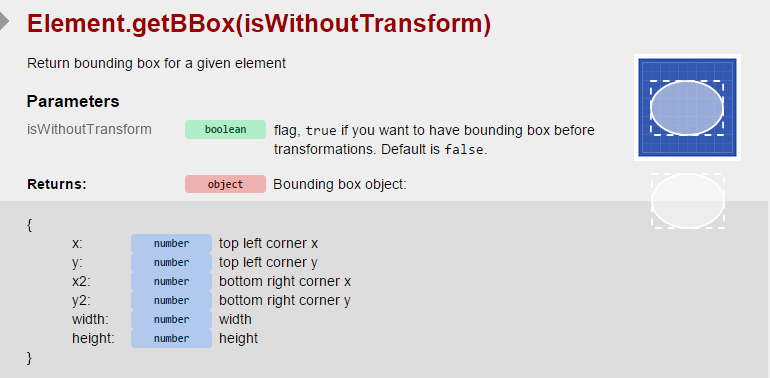
In order to do this, we need to use a bounding box. A bounding box gives us the area around the RaphaelJS element in question. Below is a diagram that shows us this effect.

Getting a bounding box involves using the getBBox command. The parameters returned by this command are the values you see in the above diagram.

We use the same circle element as before. Once we get the bounding box of the circle, we retrieve the x and y values of the circle and use its width and height for the rectangle we want to create.

Remember that the syntax to create a rectangle is:

Paper.rect(x, y, width, height, [r]);

Comparing this to our image above, x and y would be the starting points for the bounding rectangle whlie the width and height would be the width and height of the bounding box respectively.

[r] is an optional parameter that represents the border radius. We don't need it for this case so we won't use it.

The code to do this is given below:

$(function(){ var paper = Raphael('container', 500, 500);
// Draw a circle at the left hand side of the viewport
var circle = paper.circle(100, 250, 50).attr({ 'fill' : 'red', 'stroke-width' : 5 });
// Get the bounding box of the circle
var boundingBox = circle.getBBox();
// Draw the rectangle using components from the bounding box
paper.rect(boundingBox.x, boundingBox.y, boundingBox.width, boundingBox.height);

});
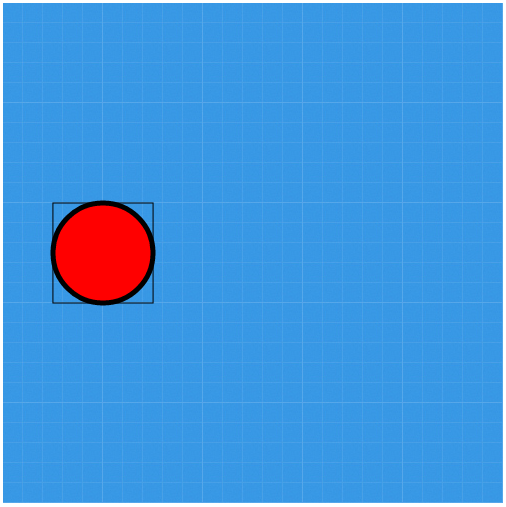
The code above produces the output shown below:
Please notice the rectangle around the circle. It shows the bounding box of the circle. An important application of this concept is to check for overlaps of two elements. I will cover that next.


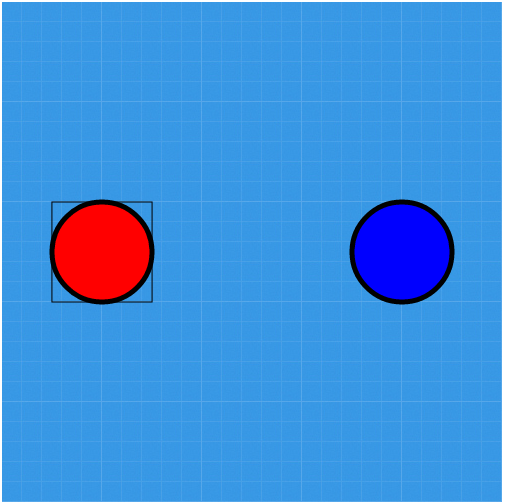
To illustrate this concept, I will draw another circle at the position of x = 400 and y = 250 with the radius = 50. We give the circle we are drawing a colour of blue to differentiate it from our previous circle.

I expect that at this point, you can write the code to do that so I will only show the output.


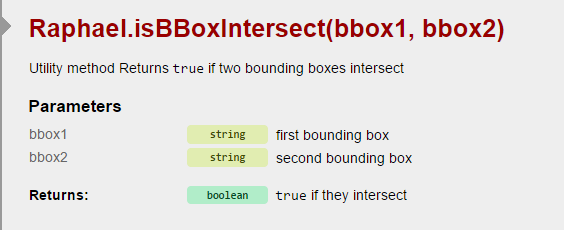
Lets add our drag methods to the first circle as before however this time in the dragend method, we add an alert method that allows us know if the two circles intersect.

In the dragstart method, we add the toFront() method to first circle to the front of the second circle when dragging starts.

The updated code or the drag functions is shown below:

$(function(){ var paper = Raphael('container', 500, 500);
// Draw a circle at the left hand side of the viewport
var circle = paper.circle(100, 250, 50).attr({ 'fill' : 'red', 'stroke-width' : 5 });
// Get the bounding box of the circle
var boundingBox = circle.getBBox();
// Draw the rectangle using components from the bounding box
paper.rect(boundingBox.x, boundingBox.y, boundingBox.width, boundingBox.height);
// Draw a circle at the left hand side of the viewport
var circle1 = paper.circle(400, 250, 50).attr({ 'fill' : 'blue', 'stroke-width' : 5 });
circle.drag(dragmove, dragstart, dragend);
function dragstart(x, y, e){
this.toFront();
this.current_transform = this.transform();
this.attr("fill", "yellow");
}
function dragmove(dx, dy, x, y, e){
this.transform(this.current_transform+'T'+dx+','+dy)
}
function dragend(e){
this.current_transform = this.transform();
this.attr("fill", "red");
// Get the bounding box for the target circle
var targetBBox = circle1.getBBox
/* Check if the bounding boxes intersect */
if(Raphael.isBBoxIntersect(boundingBox, targetBBox)){
alert("The bounding boxes intersect.");
}
else{
alert("The bounding boxes intersect.");
}
}
});

This concept is important if we decide to use SVG for collision detection. Collision detection is an important concept in game development.

This is the tenth part of this series. I have used this first 10 parts to cover basic concepts in using SVG with RaphaelJS. The purpose was to lay the ground work for projects we want to undertake.

From the next section, we shall look at how to create interactive maps. This project will tie in the concepts covered so far.

Thursday, 21 May 2015

SVG with RaphaelJS - Drag and Drop in RaphaelJS


Welcome to this section of the weekly series SVG with RaphaelJS.

The drag and drop functionality in RaphaelJS enables us to move elements from one location to another on the RaphaelJS paper.

The documentation is relatively straightforward on how to do this so an example will suffice. We start off by drawing a circle at x = 100 and y = 250 with the radius of 50. The code to do this is given below:

var circle = paper.circle(100, 250, 50).attr({ 'fill' : 'red', 'stroke-width' : 5 });

Notice that we give the circle a fill of red and a stroke-width of 5. This is shown below:


Next we write our dragstart, dragmove and dragend functions and assign them to our circle element.

Our final code is shown below.

$(function(){ var paper = Raphael('container', 500, 500);
// Draw a circle at the left hand side of the viewport
var circle = paper.circle(100, 250, 50).attr({ 'fill' : 'red', 'stroke-width' : 5 });
circle.drag(dragmove, dragstart, dragend);
function dragstart(x, y, e){
this.current_transform = this.transform();
this.attr("fill", "yellow");
}
function dragmove(dx, dy, x, y, e){
this.transform(this.current_transform+'T'+dx+','+dy)
}
function dragend(e){
this.current_transform = this.transform();
this.attr("fill", "red");
}
});

Note that in the dragstart method when we start dragging the circle, we change its fill colour to yellow.

We also get its current transform first before motion starts. This is because when motion starts, we want to move it in consideration of the transform that it had before motion.

In the dragmove function, we change the transform of the circle in consideration of how it has moved in the x and y directions. The variables dx and dy mean the difference in the motion of the circle along the x and y directions.

You can view the code for this on my dropbox or download the GitHub repository.