Wednesday, 20 May 2015

SVG with RaphaelJS - Using RaphaelJS with Other JavaScript Libraries


Welcome to this section of the weekly series SVG with RaphaelJS.

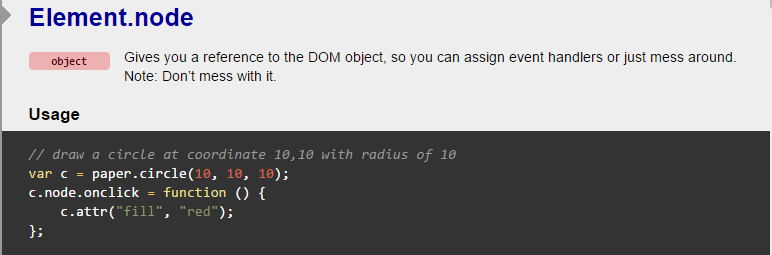
The node property is a reference to the DOM object so that you can manipulate elements in RaphaelJS using third party libraries.

In order to work with other JavaScript libraries our RaphaelJS elements must have their DOM exposed. So far we have used jQuery in our code but we haven't integrated it into RaphaelJS. In this section, we will do that.

Our template code file is given below:

$(function(){ var paper = Raphael('container', 500, 500);
});
Note that the first line is actually a jQuery command that lets the page load first before we do any other thing on the page.

Google Developer Tools
Google Chrome browser is in my opinion the best browser for a web developer because of its simplicity.

In order to use it, view the template code in the Google Chrome browser (I admit that I have always assumed you were using it). Hold down Ctrl + Shift and then press I on your keyboard. It will bring out the developer tools. The diagram is shown below:


The most important tab is the Console tab. It allows us to detect errors in our programs and will even inform you of the line causing the problem.

Accessing a RaphaelJS Element in the DOM
It is important to understand that SVG is part of the DOM structure. As a result, you can inspect SVG elements in the Chrome console.

In this example, I will use a circle to illustrate this concept. The circle will be given an id of circle using the Element.node method and we will use that reference to assign a click method to the circle in jQuery.

The code to do this is given below:

// Draw a circle at the center of your canvas var circle = paper.circle(250, 250, 50);
// Set the attributes of the circle
circle.attr({ fill: "red", cursor: "pointer" });
circle.node.id = "circle";
$("#circle").click(function(){
alert(1);
});

Copy and paste the above code below your the var paper = Raphael('container', 500, 500); in your init.js file.

You can view the repository here.

Using Qtip
Qtip is a JavaScript library that provides tooltips on DOM elements. In order to use it, simply download it and include its CSS file in the css directory of your project and the JavaScript file in the js directory of your project.

Next call them from your index.html file. The file now looks like this:

<!DOCTYPE html> <html>
<head>
<meta charset="utf-8">
<title>RaphaelJS Template</title>
<link rel="stylesheet" href="css/default.css">
<link rel="stylesheet" href="css/jquery.qtip.css">
<script src="js/jquery.js"></script>
<script src="js/jquery.qtip.js"></script>
<script src="js/raphael.js"></script>
<script src="js/init.js"></script>
</head>
<body>
<div id="container"></div>
</body>
</html>

Note the inclusion of both the CSS and JavaScript files of qtip. In order to use qtip in our code, we access the node element of the RaphaelJS element in our code. Paste the following lines of code below code in your init.js
$(circle.node).qtip({ content: { text: 'Hello. I am in the DOM' },
style: {
background: '#000000',
color: '#ffffff',
border: { width: 6, radius: 3, color: '#ff0000' }
},
position: {
my: 'left center',
at: 'bottom center',
target: 'mouse',
adjust: { x: 20, y: 25 }
}
});
console.log(circle.node);
Save your work and check it out in the browser. Now when you mouse over the circle, it pops up a message. You can view it on my dropbox.

In this section, we have looked at how to use RaphaelJS with other JavaScript libraries. This concept will prove useful when we want to create interactive maps.

Friday, 15 May 2015

SVG with RaphaelJS - Working with Text in RaphaelJS


Welcome to this section of the weekly series SVG with RaphaelJS. Creating text in RaphaelJS involves the use of the text() function. Extra attributes of a text string are the anchor position of a text string.

By default, RaphaelJS assigns the anchor position of a text string to the middle. But the other attributes are start and end.

We are going to write out a piece of text using different anchor positions 3 times to explain this concept. The code to do this is given below.

$(function(){ var paper = Raphael('container', 500, 500);
var text1 = paper.text(200, 100, "Raphaël")
.attr({ "fill": "#F00", "font-size": "40", "text-anchor": "start" });
var text2 = paper.text(200, 200, "Raphaël")
.attr({ "fill": "#F00", "font-size": "40", "text-anchor": "middle" });
var text3 = paper.text(200, 300, "Raphaël")
.attr({ "fill": "#F00", "font-size": "40", "text-anchor": "end" });
});

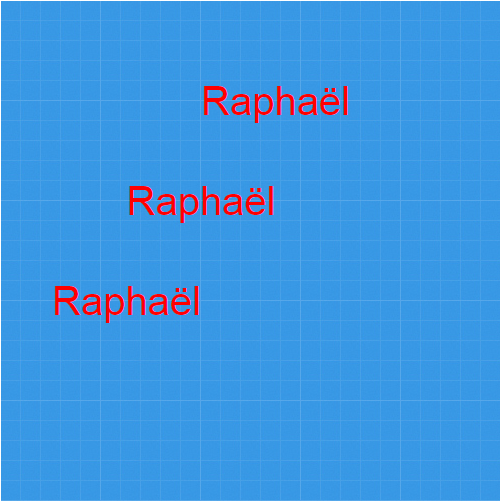
This code produces the image shown below. You can view it online here or get the full code from the GitHub repository for this course.


From the above diagram, you can see that choosing your anchor point affects how the text is displayed. Using the line at x = 200 as a guide, we see that when the text-anchor is at the start, the text starts from the line. When it is placed at its default position (middle), the text is displayed at the centre and when the text-anchor is at the end, the displayed text stops at the line.

That is all for this week on SVG with RaphaelJS. Next week we will look at using RaphaelJS with other JavaScript libraries.

Thursday, 7 May 2015

SVG with RaphaelJS - Creating Complex Shapes


Welcome to this section of the weekly series SVG with RaphaelJS. Its been a long time since I last posted anything. In that time, my company website got launched and work has started on our first game.

So far we have covered the basic shapes in RaphaelJS. We have looked at circles, ellipses and rectangles. In this section we are going to look at how to create complex shapes.

The most powerful concept in SVG is the path. You can describe any shape with the path. Any shape can be described as a set of points divided into segments.

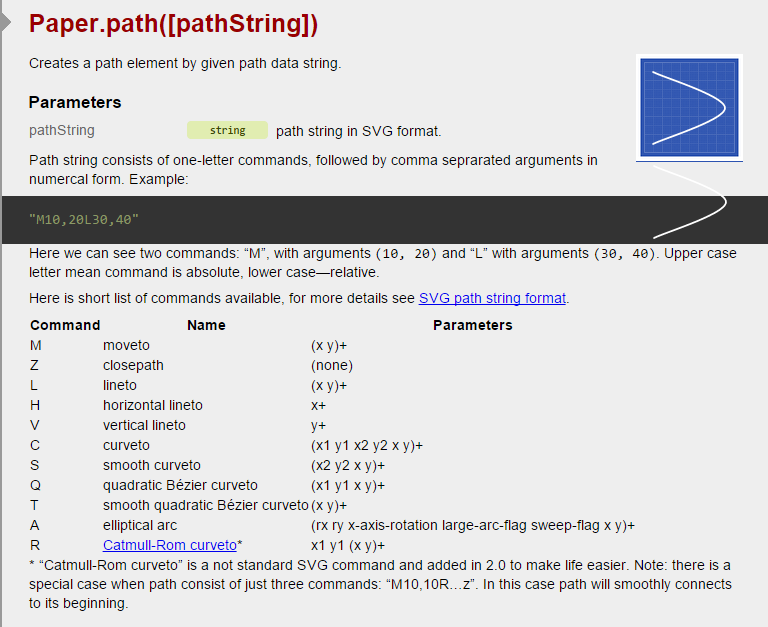
The commands above show you that you can write SVG commands by yourself. However, to do more complex tasks, you need to use a vector graphics tool like Adobe Illustrator, Inkscape or Open Office Draw. The goal when you export you graphics is to save it in the SVG file format. In Inkscape, SVG is the default file format.

In truth, there is no limit to what we can do if we learn how to use paths in SVG. The only problem is getting past the learning curve. To do this, we will start gently.

Creating a Line

The simplest way to create a line is to use a path string, start it at a position and use the L to command to specify its end position.

$(function(){
var paper = Raphael('container', 500, 500);
// Create a path using a path string
paper.path("M100,100 L200,200");
});

You can view the result here.

Once again, the entire code for this series can be downloaded from the code repository.

Our init.js thus becomes ...

In the simplest language, the code states move your drawing pen to the point 100, 100 and draw a line to the point 200, 200.

If we replace our path string with another one like this paper.path("M 100 200 200 200 300 200");

We have successfully created a line with 3 points. If we alter the middle point so that this is our new line of code,

paper.path("M 100 200 200 300 300 200");

You can view the output here.

Placing a Z at the end of the path closes the line. Thus, we have created a triangle. Try it and see.

Drawing Curves
There are three types of curve path: quadratic Bezier curves, cubic Bezier curves and arcs. Personally, I have only worked with arcs so that is what this section will cover.

Drawing Arcs
I learned how to do this by trial and error. Only when I had accomplished what I set out to do did I finally the meaning of the commands.

I was trying to create a gauge as an example for this series. The first step in doing this is to create an arc between two points.


Please view the code repository for this series. Check the curve folder for week 6. I am not pasting it here because it is too long.

Working with Paths from a Software Program
At the end of the day, the best way to create your paths is to use a software program and extract the relevant paths that you need.

To do this, I advise you get a graphics designer to create your graphics for you and save it as an SVG file.

 All you need to look for is the point in the file where d=””. Copy out what you find in between the d value and you have your path.

I must add this requires some trial and error on your part. I will go more into this when I delve into the creation of interactive maps later in this series.

Friday, 13 March 2015

SVG with RaphaelJS - Creating Basic Shapes - Drawing Rectangles with RaphaelJS

Welcome to this section of the weekly series SVG with RaphaelJS. This week will we continue our creation of basic shapes with RaphaelJS by working with rectangles.

The rectangle method is simple in itself. It draws a rectangle on the screen. Let's remember that a square is a special case of a rectangle where the width = height. So if we wanted to draw a rectangle, we would ensure that our height and width are equal.

The actual syntax to do this is;

Paper.rect(x, y, width, height, [r])

As shown above, we use the rect() method to create a rectangle. [r] is an optional parameter that represents the border radius. This parameter allows us create a rectangle with a rounded edge.

Our init.js in this case thus becomes:

$(function(){ var paper = Raphael('container', 500, 500);
// Draw a red rectangle
var rectangle = paper.rect(100, 100, 200, 100).attr("fill", "red");
});
The above code draws a red rectangle on the grid. You can view the output here. The GitHub repository can be found here.

To create a rectangle with a rounded corner of 40, our init.js becomes:

$(function(){ var paper = Raphael('container', 500, 500);
// Draw a rectangle with rounded corners
var rectangle = paper.rect(100, 100, 200, 100, 40).attr("fill", "red");
});

You can view the result here.

So far we have covered the basic elements in RaphaelJS. With what we have done so far, you should have some ideas running through your head. Stop a while and write them down. Let your imagination run free in this regard.

That was how I started on the journey of using SVG. Along the line, I met people who encouraged me to bring me ideas to life by offering advice and the rest the say is history.

In the next section of this series SVG with RaphaelJS, we shall be looking at paths. Paths are complex shapes that truly show the power of SVG. See you next week.